
Factors Influencing the Value of Alternative Cryptocurrencies
Understanding what drives the value of alternative cryptocurrencies, commonly known as altcoins, is essential for investors, developers, and enthusiasts alike. Altcoins operate independently from Bitcoin but are often influenced by similar market forces and technological developments. This article explores the key factors that impact their valuation, providing a comprehensive overview grounded in current industry insights.
Market Sentiment and Adoption Rates
Market sentiment plays a pivotal role in shaping the price movements of altcoins. Positive news such as regulatory approvals, technological breakthroughs, or endorsements from influential figures can boost investor confidence. Conversely, negative headlines—like security breaches or regulatory crackdowns—can trigger sharp declines.
Adoption rates are equally critical; when more users and businesses start accepting or utilizing an altcoin, demand naturally increases. Higher adoption enhances liquidity—the ease with which assets can be bought or sold without affecting their price—which tends to stabilize prices over time. For example, widespread acceptance of certain stablecoins has contributed to their relatively steady valuations compared to more volatile tokens.
Technological Advancements and Blockchain Capabilities
The underlying technology behind an altcoin significantly influences its perceived value. Advanced blockchain features such as enhanced security protocols or faster transaction speeds attract investor interest because they address common issues like scalability and network vulnerabilities.
Smart contracts and decentralized applications (DApps) further add utility to an altcoin’s ecosystem. Projects that support these functionalities tend to have higher utility value because they enable complex financial operations without intermediaries—making them attractive for DeFi (Decentralized Finance) applications and enterprise solutions alike.
Regulatory Environment Impact
Government policies and regulations directly affect how altcoins are perceived in mainstream finance markets. Clearer regulatory frameworks tend to foster trust among investors by reducing uncertainty about legal compliance risks.
For instance, jurisdictions that implement comprehensive AML (Anti-Money Laundering) and KYC (Know Your Customer) standards facilitate easier listing on major exchanges—thus increasing accessibility for traders worldwide. Conversely, restrictive regulations can limit trading options or even lead to delistings from exchanges if compliance standards aren’t met.
Supply Dynamics: Tokenomics & Liquidity
Tokenomics—the economic model governing supply distribution—is fundamental in determining an altcoin’s market behavior. Factors such as total supply caps (e.g., Bitcoin’s 21 million limit), inflation rates through mining rewards or token releases influence scarcity perceptions among investors.
High liquidity levels also contribute positively; markets with numerous buyers and sellers tend to experience less volatility because large trades won’t drastically sway prices—a vital consideration during periods of heightened market activity or sudden shifts in sentiment.
Security Measures & Network Scalability
Security remains paramount for maintaining trust within any cryptocurrency ecosystem. Networks vulnerable to hacking incidents risk losing user confidence rapidly; notable breaches have historically caused significant drops in token values across various projects.
Scalability addresses whether a network can handle increasing transaction volumes efficiently—a necessity for mass adoption beyond niche communities. Projects capable of scaling effectively often enjoy sustained growth prospects due to their ability to serve larger user bases without compromising performance or security standards.
Competitive Landscape: Positioning Among Altcoins & Bitcoin Influence
The competitive environment within the crypto space shapes individual coin valuations considerably. While Bitcoin dominates market capitalization—and exerts influence over overall sentiment—altcoins must differentiate themselves through unique features like faster transactions (e.g., Litecoin), privacy enhancements (e.g., Monero), or specialized use cases like gaming tokens.
When Bitcoin experiences significant price movements—either upward surges or downturns—it often impacts broader market confidence affecting all cryptocurrencies including altcoins indirectly through investor psychology rather than fundamentals alone.
Recent Trends Shaping Altcoin Valuations
Growth Driven by Decentralized Finance (DeFi)
DeFi has revolutionized how digital assets are used by enabling lending platforms, yield farming strategies, staking pools—and many other financial services—all built on blockchain networks supporting smart contracts like Ethereum's platform. The surge in DeFi projects has led many related tokens’ values skyrocket due to increased demand driven by innovative use cases offering high yields compared with traditional finance options.
Institutional Investment Enhancing Market Stability
As institutional players—including hedge funds and asset managers—increase exposure via regulated channels such as futures contracts or custody solutions they bring greater liquidity into crypto markets overall—including specific promising altcoins with strong fundamentals—which helps reduce volatility spikes historically associated with retail-driven speculation.
Regulatory Clarity Supporting Growth
Governments worldwide are gradually establishing clearer rules around digital assets—for example U.S regulators issuing guidance on securities classification—that help legitimize certain types of tokens while discouraging illicit activities like money laundering via anonymous transactions.
Risks That Could Affect Altcoin Values
Despite positive developments there remain inherent risks impacting valuation stability:
- Market Volatility: Cryptocurrency prices remain highly sensitive; sudden shifts driven by macroeconomic factors—or social media trends—can cause rapid fluctuations.
- Security Vulnerabilities: Flaws within codebases may lead hackers exploiting vulnerabilities resulting in loss of funds.
- Intensified Competition: As new projects emerge offering innovative features—from privacy-focused coins versus scalable layer-two solutions—their ability to capture market share could threaten existing coins’ dominance.
Navigating the Complex World of Altcoin Valuation
Investors seeking exposure should consider multiple factors—from technological robustness through regulatory landscape—to make informed decisions aligned with long-term growth potential rather than short-term speculation tendencies.
Keywords: alternative cryptocurrencies valuation | factors influencing crypto prices | blockchain technology impact | DeFi growth effects | crypto regulation influence | tokenomics principles | cryptocurrency security risks


kai
2025-06-09 05:03
What factors influence the value of alternative cryptocurrencies?
Factors Influencing the Value of Alternative Cryptocurrencies
Understanding what drives the value of alternative cryptocurrencies, commonly known as altcoins, is essential for investors, developers, and enthusiasts alike. Altcoins operate independently from Bitcoin but are often influenced by similar market forces and technological developments. This article explores the key factors that impact their valuation, providing a comprehensive overview grounded in current industry insights.
Market Sentiment and Adoption Rates
Market sentiment plays a pivotal role in shaping the price movements of altcoins. Positive news such as regulatory approvals, technological breakthroughs, or endorsements from influential figures can boost investor confidence. Conversely, negative headlines—like security breaches or regulatory crackdowns—can trigger sharp declines.
Adoption rates are equally critical; when more users and businesses start accepting or utilizing an altcoin, demand naturally increases. Higher adoption enhances liquidity—the ease with which assets can be bought or sold without affecting their price—which tends to stabilize prices over time. For example, widespread acceptance of certain stablecoins has contributed to their relatively steady valuations compared to more volatile tokens.
Technological Advancements and Blockchain Capabilities
The underlying technology behind an altcoin significantly influences its perceived value. Advanced blockchain features such as enhanced security protocols or faster transaction speeds attract investor interest because they address common issues like scalability and network vulnerabilities.
Smart contracts and decentralized applications (DApps) further add utility to an altcoin’s ecosystem. Projects that support these functionalities tend to have higher utility value because they enable complex financial operations without intermediaries—making them attractive for DeFi (Decentralized Finance) applications and enterprise solutions alike.
Regulatory Environment Impact
Government policies and regulations directly affect how altcoins are perceived in mainstream finance markets. Clearer regulatory frameworks tend to foster trust among investors by reducing uncertainty about legal compliance risks.
For instance, jurisdictions that implement comprehensive AML (Anti-Money Laundering) and KYC (Know Your Customer) standards facilitate easier listing on major exchanges—thus increasing accessibility for traders worldwide. Conversely, restrictive regulations can limit trading options or even lead to delistings from exchanges if compliance standards aren’t met.
Supply Dynamics: Tokenomics & Liquidity
Tokenomics—the economic model governing supply distribution—is fundamental in determining an altcoin’s market behavior. Factors such as total supply caps (e.g., Bitcoin’s 21 million limit), inflation rates through mining rewards or token releases influence scarcity perceptions among investors.
High liquidity levels also contribute positively; markets with numerous buyers and sellers tend to experience less volatility because large trades won’t drastically sway prices—a vital consideration during periods of heightened market activity or sudden shifts in sentiment.
Security Measures & Network Scalability
Security remains paramount for maintaining trust within any cryptocurrency ecosystem. Networks vulnerable to hacking incidents risk losing user confidence rapidly; notable breaches have historically caused significant drops in token values across various projects.
Scalability addresses whether a network can handle increasing transaction volumes efficiently—a necessity for mass adoption beyond niche communities. Projects capable of scaling effectively often enjoy sustained growth prospects due to their ability to serve larger user bases without compromising performance or security standards.
Competitive Landscape: Positioning Among Altcoins & Bitcoin Influence
The competitive environment within the crypto space shapes individual coin valuations considerably. While Bitcoin dominates market capitalization—and exerts influence over overall sentiment—altcoins must differentiate themselves through unique features like faster transactions (e.g., Litecoin), privacy enhancements (e.g., Monero), or specialized use cases like gaming tokens.
When Bitcoin experiences significant price movements—either upward surges or downturns—it often impacts broader market confidence affecting all cryptocurrencies including altcoins indirectly through investor psychology rather than fundamentals alone.
Recent Trends Shaping Altcoin Valuations
Growth Driven by Decentralized Finance (DeFi)
DeFi has revolutionized how digital assets are used by enabling lending platforms, yield farming strategies, staking pools—and many other financial services—all built on blockchain networks supporting smart contracts like Ethereum's platform. The surge in DeFi projects has led many related tokens’ values skyrocket due to increased demand driven by innovative use cases offering high yields compared with traditional finance options.
Institutional Investment Enhancing Market Stability
As institutional players—including hedge funds and asset managers—increase exposure via regulated channels such as futures contracts or custody solutions they bring greater liquidity into crypto markets overall—including specific promising altcoins with strong fundamentals—which helps reduce volatility spikes historically associated with retail-driven speculation.
Regulatory Clarity Supporting Growth
Governments worldwide are gradually establishing clearer rules around digital assets—for example U.S regulators issuing guidance on securities classification—that help legitimize certain types of tokens while discouraging illicit activities like money laundering via anonymous transactions.
Risks That Could Affect Altcoin Values
Despite positive developments there remain inherent risks impacting valuation stability:
- Market Volatility: Cryptocurrency prices remain highly sensitive; sudden shifts driven by macroeconomic factors—or social media trends—can cause rapid fluctuations.
- Security Vulnerabilities: Flaws within codebases may lead hackers exploiting vulnerabilities resulting in loss of funds.
- Intensified Competition: As new projects emerge offering innovative features—from privacy-focused coins versus scalable layer-two solutions—their ability to capture market share could threaten existing coins’ dominance.
Navigating the Complex World of Altcoin Valuation
Investors seeking exposure should consider multiple factors—from technological robustness through regulatory landscape—to make informed decisions aligned with long-term growth potential rather than short-term speculation tendencies.
Keywords: alternative cryptocurrencies valuation | factors influencing crypto prices | blockchain technology impact | DeFi growth effects | crypto regulation influence | tokenomics principles | cryptocurrency security risks
Disclaimer:Contains third-party content. Not financial advice.
See Terms and Conditions.
How OKX Pay Caters to the Next Generation of Crypto Users
Understanding the Rise of Cryptocurrency Adoption Among Young Investors
Over the past decade, cryptocurrency has transitioned from a niche digital asset to a mainstream financial instrument. The surge in adoption is largely driven by younger demographics—millennials and Gen Z—who are more open to exploring decentralized finance (DeFi), blockchain technology, and digital currencies. These users often seek platforms that are intuitive, fast, and integrated with their daily financial routines. Recognizing this shift, OKX launched OKX Pay in 2023 as a strategic move to meet the evolving needs of this next-generation crypto community.
User-Friendly Platform Designed for Beginners and Experienced Traders
One of OKX Pay’s core strengths lies in its focus on accessibility. Unlike traditional crypto exchanges that can be complex or intimidating for newcomers, OKX Pay emphasizes simplicity without sacrificing functionality. Its interface is designed with ease-of-use in mind—featuring straightforward navigation, clear transaction processes, and minimal technical jargon—which appeals particularly to young users who may be new to cryptocurrencies.
The platform supports instant deposits and withdrawals across multiple cryptocurrencies, making it convenient for users who want quick access to their funds. Additionally, integration with popular payment methods such as credit/debit cards, bank transfers, Apple Pay, Google Pay, and mobile wallets ensures that transactions align seamlessly with everyday financial activities.
Bridging Traditional Finance With Cryptocurrency Transactions
OKX Pay aims to bridge the gap between traditional banking systems and digital assets by offering seamless transfer capabilities between user accounts on its platform. This integration allows users not only to buy or sell cryptocurrencies but also to spend or receive them effortlessly—whether shopping online or transferring funds domestically or internationally.
Security remains paramount; therefore, OKX employs robust encryption protocols alongside multi-factor authentication (MFA) measures. These security features help protect user assets against cyber threats—a critical consideration given increasing concerns over data breaches within fintech ecosystems.
Catering Specifically To Younger Demographics
Targeting the next generation of investors means understanding their preferences: convenience-driven experiences combined with transparency around fees and security practices. OKX Pay addresses these demands through:
- Low Transaction Fees: Competitive fee structures encourage frequent use.
- Educational Resources: Simplified onboarding processes help first-time users understand how cryptocurrency transactions work.
- Mobile Optimization: Fully functional mobile app support aligns well with younger audiences who predominantly operate via smartphones.
By focusing on these aspects—and ensuring an engaging yet secure environment—OKX positions itself as an accessible gateway into crypto investing for those just starting out or looking for streamlined transaction options.
Strategic Partnerships Enhancing User Experience
To expand its reach among young investors globally—and ensure regulatory compliance—OKX has partnered with various fintech firms and financial institutions worldwide. These collaborations facilitate smoother integrations with local banking systems while adhering strictly to regional regulations concerning anti-money laundering (AML) policies and Know Your Customer (KYC) procedures.
Such partnerships also enable features like fiat-to-crypto conversions directly within the platform—a crucial aspect for new investors seeking familiar payment methods without navigating complex conversion processes externally.
Recent Innovations Supporting Growth & Security
In 2024 alone, OKX introduced several enhancements aimed at improving user experience:
- Expanded Payment Options: Support for Apple Pay & Google Pay was added in April 2024; making transactions even more convenient via mobile devices.
- Enhanced Security Measures: June 2024 saw deployment of AI-powered fraud detection tools along with upgraded two-factor authentication systems designed specifically against emerging cyber threats.
These innovations reflect an ongoing commitment by OKX toward safeguarding user assets while providing cutting-edge functionalities tailored toward tech-savvy youth eager for innovation-driven solutions.
Addressing Challenges Facing Next-Gen Crypto Platforms
Despite rapid growth prospects—including over 50% increase in active users reported mid-2025—the platform faces challenges typical within this space:
- Regulatory Environment: As governments tighten regulations around cryptocurrencies worldwide—including licensing requirements—the operational landscape could become more complex.
- Market Volatility: Fluctuations inherent in crypto markets can impact confidence levels among less experienced traders relying heavily on stable value perceptions.
- Security Risks: Cyberattacks remain a persistent threat; even advanced security measures cannot eliminate all risks associated with hacking attempts or data breaches which could undermine trust if incidents occur unexpectedly.
Proactively addressing these issues will be vital if platforms like OKX Pay intend sustained growth among young investors seeking reliable yet innovative solutions aligned closely with evolving legal standards globally.
How Platforms Like OKX Are Shaping Future Crypto Adoption
As cryptocurrency continues gaining mainstream acceptance—with institutional investments rising alongside retail participation—the importance of accessible platforms cannot be overstated. By prioritizing ease-of-use combined with high-security standards tailored towards younger audiences’ preferences—for example through intuitive interfaces supporting diverse payment options—OKX is positioning itself as a key enabler of mass adoption among future crypto enthusiasts.
Final Thoughts: Meeting Next Generation Expectations Through Innovation & Security
In summary, OKX Pay exemplifies how modern crypto services are adapting their offerings specifically toward emerging demographics eager for seamless digital asset management integrated into daily life routines. Its focus on simplicity without compromising security makes it attractive not only today but also positions it well amid ongoing regulatory developments shaping tomorrow’s landscape.
By continuously innovating—from expanding payment options like Apple/Google Wallets—to deploying advanced fraud detection technologies — platforms such as OK X demonstrate leadership essential for fostering trust among new entrants into cryptocurrency markets while supporting broader adoption goals across diverse regions worldwide

Lo
2025-06-09 02:12
How does OKX Pay cater to the next crypto generation?
How OKX Pay Caters to the Next Generation of Crypto Users
Understanding the Rise of Cryptocurrency Adoption Among Young Investors
Over the past decade, cryptocurrency has transitioned from a niche digital asset to a mainstream financial instrument. The surge in adoption is largely driven by younger demographics—millennials and Gen Z—who are more open to exploring decentralized finance (DeFi), blockchain technology, and digital currencies. These users often seek platforms that are intuitive, fast, and integrated with their daily financial routines. Recognizing this shift, OKX launched OKX Pay in 2023 as a strategic move to meet the evolving needs of this next-generation crypto community.
User-Friendly Platform Designed for Beginners and Experienced Traders
One of OKX Pay’s core strengths lies in its focus on accessibility. Unlike traditional crypto exchanges that can be complex or intimidating for newcomers, OKX Pay emphasizes simplicity without sacrificing functionality. Its interface is designed with ease-of-use in mind—featuring straightforward navigation, clear transaction processes, and minimal technical jargon—which appeals particularly to young users who may be new to cryptocurrencies.
The platform supports instant deposits and withdrawals across multiple cryptocurrencies, making it convenient for users who want quick access to their funds. Additionally, integration with popular payment methods such as credit/debit cards, bank transfers, Apple Pay, Google Pay, and mobile wallets ensures that transactions align seamlessly with everyday financial activities.
Bridging Traditional Finance With Cryptocurrency Transactions
OKX Pay aims to bridge the gap between traditional banking systems and digital assets by offering seamless transfer capabilities between user accounts on its platform. This integration allows users not only to buy or sell cryptocurrencies but also to spend or receive them effortlessly—whether shopping online or transferring funds domestically or internationally.
Security remains paramount; therefore, OKX employs robust encryption protocols alongside multi-factor authentication (MFA) measures. These security features help protect user assets against cyber threats—a critical consideration given increasing concerns over data breaches within fintech ecosystems.
Catering Specifically To Younger Demographics
Targeting the next generation of investors means understanding their preferences: convenience-driven experiences combined with transparency around fees and security practices. OKX Pay addresses these demands through:
- Low Transaction Fees: Competitive fee structures encourage frequent use.
- Educational Resources: Simplified onboarding processes help first-time users understand how cryptocurrency transactions work.
- Mobile Optimization: Fully functional mobile app support aligns well with younger audiences who predominantly operate via smartphones.
By focusing on these aspects—and ensuring an engaging yet secure environment—OKX positions itself as an accessible gateway into crypto investing for those just starting out or looking for streamlined transaction options.
Strategic Partnerships Enhancing User Experience
To expand its reach among young investors globally—and ensure regulatory compliance—OKX has partnered with various fintech firms and financial institutions worldwide. These collaborations facilitate smoother integrations with local banking systems while adhering strictly to regional regulations concerning anti-money laundering (AML) policies and Know Your Customer (KYC) procedures.
Such partnerships also enable features like fiat-to-crypto conversions directly within the platform—a crucial aspect for new investors seeking familiar payment methods without navigating complex conversion processes externally.
Recent Innovations Supporting Growth & Security
In 2024 alone, OKX introduced several enhancements aimed at improving user experience:
- Expanded Payment Options: Support for Apple Pay & Google Pay was added in April 2024; making transactions even more convenient via mobile devices.
- Enhanced Security Measures: June 2024 saw deployment of AI-powered fraud detection tools along with upgraded two-factor authentication systems designed specifically against emerging cyber threats.
These innovations reflect an ongoing commitment by OKX toward safeguarding user assets while providing cutting-edge functionalities tailored toward tech-savvy youth eager for innovation-driven solutions.
Addressing Challenges Facing Next-Gen Crypto Platforms
Despite rapid growth prospects—including over 50% increase in active users reported mid-2025—the platform faces challenges typical within this space:
- Regulatory Environment: As governments tighten regulations around cryptocurrencies worldwide—including licensing requirements—the operational landscape could become more complex.
- Market Volatility: Fluctuations inherent in crypto markets can impact confidence levels among less experienced traders relying heavily on stable value perceptions.
- Security Risks: Cyberattacks remain a persistent threat; even advanced security measures cannot eliminate all risks associated with hacking attempts or data breaches which could undermine trust if incidents occur unexpectedly.
Proactively addressing these issues will be vital if platforms like OKX Pay intend sustained growth among young investors seeking reliable yet innovative solutions aligned closely with evolving legal standards globally.
How Platforms Like OKX Are Shaping Future Crypto Adoption
As cryptocurrency continues gaining mainstream acceptance—with institutional investments rising alongside retail participation—the importance of accessible platforms cannot be overstated. By prioritizing ease-of-use combined with high-security standards tailored towards younger audiences’ preferences—for example through intuitive interfaces supporting diverse payment options—OKX is positioning itself as a key enabler of mass adoption among future crypto enthusiasts.
Final Thoughts: Meeting Next Generation Expectations Through Innovation & Security
In summary, OKX Pay exemplifies how modern crypto services are adapting their offerings specifically toward emerging demographics eager for seamless digital asset management integrated into daily life routines. Its focus on simplicity without compromising security makes it attractive not only today but also positions it well amid ongoing regulatory developments shaping tomorrow’s landscape.
By continuously innovating—from expanding payment options like Apple/Google Wallets—to deploying advanced fraud detection technologies — platforms such as OK X demonstrate leadership essential for fostering trust among new entrants into cryptocurrency markets while supporting broader adoption goals across diverse regions worldwide
Disclaimer:Contains third-party content. Not financial advice.
See Terms and Conditions.
How Is Dogecoin Different from Bitcoin?
Understanding the differences between Dogecoin and Bitcoin is essential for anyone interested in cryptocurrencies, whether you're a new investor or an experienced trader. Both digital currencies have unique features, origins, and market behaviors that influence their roles within the broader crypto ecosystem. This article explores these distinctions in detail to help clarify how each operates and what sets them apart.
Origins of Bitcoin and Dogecoin
Bitcoin was created in 2008 by an anonymous person or group using the pseudonym Satoshi Nakamoto. It was launched in January 2009 with the goal of establishing a decentralized digital currency free from government control. As the first cryptocurrency, Bitcoin introduced blockchain technology—a transparent ledger that records all transactions across a network of computers—laying the foundation for countless other cryptocurrencies.
Dogecoin, on the other hand, emerged much later in December 2013. It was developed by Jackson Palmer and Billy Markus as a lighthearted alternative to Bitcoin, inspired by the popular "Doge" meme featuring a Shiba Inu dog. Initially conceived as a joke or parody cryptocurrency, Dogecoin quickly gained popularity due to its fun branding and active community support.
Technical Specifications: Blockchain & Transaction Mechanics
One of the key differences between these two cryptocurrencies lies in their technical architecture:
Blockchain Technology: Both use proof-of-work (PoW) consensus algorithms that require miners to solve complex mathematical problems to validate transactions. However, their implementation details differ significantly.
Block Time:
- Bitcoin: Processes new blocks approximately every 10 minutes.
- Dogecoin: Has a faster block time of about one minute, enabling quicker transaction confirmation.
Supply Limits:
- Bitcoin: Has a fixed supply cap at 21 million coins—this scarcity has contributed heavily to its value proposition.
- Dogecoin: Does not have such strict scarcity; its total supply is capped at around 10 billion coins initially but continues to be mined indefinitely without an upper limit.
Transaction Speed & Costs: Due to its faster block time, Dogecoin generally offers quicker transaction processing with lower fees compared to Bitcoin’s slower network which can sometimes lead to higher transaction costs during peak times.
These technical differences influence how each currency is used—Bitcoin often functions as digital gold or store of value due to its limited supply and security features; meanwhile, Dogecoin's speed makes it suitable for tipping content creators or small transactions within online communities.
Market Dynamics & Adoption Trends
Market behavior reflects both technological attributes and community engagement:
Market Capitalization & Value:
Bitcoin dominates as the largest cryptocurrency by market capitalization globally. Its widespread adoption among institutional investors has cemented its status as "digital gold." Its high volatility presents risks but also opportunities for significant gains.
Conversely, Dogecoin's market cap remains substantially smaller but has experienced notable surges driven largely by social media hype rather than institutional backing alone.
Volatility & Community Influence:
While both are volatile assets—common among cryptocurrencies—Dogecoin tends toward less extreme swings compared with Bitcoin’s rapid price fluctuations during bull markets. The strength behind Dogecoin lies heavily in its active community which frequently promotes it through platforms like Reddit and Twitter; this grassroots support often results in sudden price movements based on social sentiment rather than fundamental financial metrics.
In contrast, Bitcoin’s adoption rate among mainstream financial institutions lends it more stability over time despite short-term volatility spikes.
Recent Developments Impacting Both Cryptocurrencies
Recent news highlights ongoing regulatory scrutiny affecting both assets:
On May 10th ,2025—the SEC delayed approval for Bitwise's proposed Dogecoin ETF until June 15th . This move underscores increasing regulatory oversight aimed at protecting investors but also introduces uncertainty into how regulators will treat various crypto products moving forward.
Community-driven initiatives continue shaping public perception around both currencies; however,regulatory delays could hinder further mainstream acceptance especially if governments impose stricter rules on trading platforms or token offerings.
Regulatory Environment & Future Outlook
The evolving regulatory landscape plays a crucial role in shaping future prospects for both cryptocurrencies:
- Increased scrutiny from authorities like SEC may lead toward tighter regulations on crypto exchanges and investment vehicles such as ETFs (Exchange-Traded Funds). Such measures could impact liquidity levels or restrict certain trading activities involving tokens like Dogecoin.
- Competition between established players like Bitcoin versus newer entrants such as Dogecoin influences overall market dynamics; while some see potential growth driven by community support (as seen with meme coins), others emphasize security standards rooted in proven blockchain technology.
- Institutional interest remains pivotal: While institutions have shown growing interest primarily towards Bitcoin due to perceived stability and recognition from major companies—including Tesla—their stance on meme-based coins remains cautious yet open-minded depending on regulatory developments.
Key Takeaways About How They Differ
To summarize some core distinctions:
Origins: Created nearly five years apart with different initial purposes—Bitcoin aiming for decentralization; Doge starting as satire/community project.
Technical Specs: Faster block times (1 minute vs ~10 minutes), differing supply caps (21 million vs ~10 billion), varying transaction speeds/costs.
Market Role: Dominant store of value versus niche internet culture asset supported strongly by communities rather than institutional backing alone.
By understanding these fundamental differences—and considering ongoing developments—you can better evaluate each cryptocurrency's potential role within your investment strategy or usage scenario while appreciating their unique contributions within blockchain innovation efforts worldwide.
JCUSER-F1IIaxXA
2025-05-29 05:45
How is Dogecoin different from Bitcoin?
How Is Dogecoin Different from Bitcoin?
Understanding the differences between Dogecoin and Bitcoin is essential for anyone interested in cryptocurrencies, whether you're a new investor or an experienced trader. Both digital currencies have unique features, origins, and market behaviors that influence their roles within the broader crypto ecosystem. This article explores these distinctions in detail to help clarify how each operates and what sets them apart.
Origins of Bitcoin and Dogecoin
Bitcoin was created in 2008 by an anonymous person or group using the pseudonym Satoshi Nakamoto. It was launched in January 2009 with the goal of establishing a decentralized digital currency free from government control. As the first cryptocurrency, Bitcoin introduced blockchain technology—a transparent ledger that records all transactions across a network of computers—laying the foundation for countless other cryptocurrencies.
Dogecoin, on the other hand, emerged much later in December 2013. It was developed by Jackson Palmer and Billy Markus as a lighthearted alternative to Bitcoin, inspired by the popular "Doge" meme featuring a Shiba Inu dog. Initially conceived as a joke or parody cryptocurrency, Dogecoin quickly gained popularity due to its fun branding and active community support.
Technical Specifications: Blockchain & Transaction Mechanics
One of the key differences between these two cryptocurrencies lies in their technical architecture:
Blockchain Technology: Both use proof-of-work (PoW) consensus algorithms that require miners to solve complex mathematical problems to validate transactions. However, their implementation details differ significantly.
Block Time:
- Bitcoin: Processes new blocks approximately every 10 minutes.
- Dogecoin: Has a faster block time of about one minute, enabling quicker transaction confirmation.
Supply Limits:
- Bitcoin: Has a fixed supply cap at 21 million coins—this scarcity has contributed heavily to its value proposition.
- Dogecoin: Does not have such strict scarcity; its total supply is capped at around 10 billion coins initially but continues to be mined indefinitely without an upper limit.
Transaction Speed & Costs: Due to its faster block time, Dogecoin generally offers quicker transaction processing with lower fees compared to Bitcoin’s slower network which can sometimes lead to higher transaction costs during peak times.
These technical differences influence how each currency is used—Bitcoin often functions as digital gold or store of value due to its limited supply and security features; meanwhile, Dogecoin's speed makes it suitable for tipping content creators or small transactions within online communities.
Market Dynamics & Adoption Trends
Market behavior reflects both technological attributes and community engagement:
Market Capitalization & Value:
Bitcoin dominates as the largest cryptocurrency by market capitalization globally. Its widespread adoption among institutional investors has cemented its status as "digital gold." Its high volatility presents risks but also opportunities for significant gains.
Conversely, Dogecoin's market cap remains substantially smaller but has experienced notable surges driven largely by social media hype rather than institutional backing alone.
Volatility & Community Influence:
While both are volatile assets—common among cryptocurrencies—Dogecoin tends toward less extreme swings compared with Bitcoin’s rapid price fluctuations during bull markets. The strength behind Dogecoin lies heavily in its active community which frequently promotes it through platforms like Reddit and Twitter; this grassroots support often results in sudden price movements based on social sentiment rather than fundamental financial metrics.
In contrast, Bitcoin’s adoption rate among mainstream financial institutions lends it more stability over time despite short-term volatility spikes.
Recent Developments Impacting Both Cryptocurrencies
Recent news highlights ongoing regulatory scrutiny affecting both assets:
On May 10th ,2025—the SEC delayed approval for Bitwise's proposed Dogecoin ETF until June 15th . This move underscores increasing regulatory oversight aimed at protecting investors but also introduces uncertainty into how regulators will treat various crypto products moving forward.
Community-driven initiatives continue shaping public perception around both currencies; however,regulatory delays could hinder further mainstream acceptance especially if governments impose stricter rules on trading platforms or token offerings.
Regulatory Environment & Future Outlook
The evolving regulatory landscape plays a crucial role in shaping future prospects for both cryptocurrencies:
- Increased scrutiny from authorities like SEC may lead toward tighter regulations on crypto exchanges and investment vehicles such as ETFs (Exchange-Traded Funds). Such measures could impact liquidity levels or restrict certain trading activities involving tokens like Dogecoin.
- Competition between established players like Bitcoin versus newer entrants such as Dogecoin influences overall market dynamics; while some see potential growth driven by community support (as seen with meme coins), others emphasize security standards rooted in proven blockchain technology.
- Institutional interest remains pivotal: While institutions have shown growing interest primarily towards Bitcoin due to perceived stability and recognition from major companies—including Tesla—their stance on meme-based coins remains cautious yet open-minded depending on regulatory developments.
Key Takeaways About How They Differ
To summarize some core distinctions:
Origins: Created nearly five years apart with different initial purposes—Bitcoin aiming for decentralization; Doge starting as satire/community project.
Technical Specs: Faster block times (1 minute vs ~10 minutes), differing supply caps (21 million vs ~10 billion), varying transaction speeds/costs.
Market Role: Dominant store of value versus niche internet culture asset supported strongly by communities rather than institutional backing alone.
By understanding these fundamental differences—and considering ongoing developments—you can better evaluate each cryptocurrency's potential role within your investment strategy or usage scenario while appreciating their unique contributions within blockchain innovation efforts worldwide.
Disclaimer:Contains third-party content. Not financial advice.
See Terms and Conditions.
How to Place a Limit Order on TradingView: A Step-by-Step Guide
Placing a limit order is a fundamental strategy for traders looking to execute trades at specific prices. Whether you are trading stocks, cryptocurrencies, or other assets on TradingView, understanding how to effectively set and manage limit orders can significantly improve your trading outcomes. This guide provides a clear overview of the process, recent platform updates, and potential risks involved.
What Is a Limit Order?
A limit order is an instruction to buy or sell an asset at a predetermined price or better. Unlike market orders that execute immediately at the current market price, limit orders only trigger when the asset reaches your specified price point. For example, if you want to buy Bitcoin at $30,000 but not higher, you would place a buy limit order with that exact price. The order remains pending until the market hits that level or your specified expiration time.
Limit orders are especially useful in volatile markets like cryptocurrencies where prices can fluctuate rapidly within short periods. They allow traders to control entry and exit points more precisely while avoiding unfavorable execution prices often associated with market orders.
Accessing TradingView for Limit Orders
TradingView offers both web-based and mobile platforms designed for user-friendly navigation and comprehensive chart analysis. To place a limit order:
- Log into your TradingView account via their website or mobile app.
- Navigate through the interface to select your desired financial instrument—be it stocks, crypto assets, forex pairs, etc.
- Use the search bar by entering the asset’s symbol (e.g., BTCUSD) or browse through available markets.
Once you've selected an asset:
- Click on "Trade" or "Order" buttons typically located near charts.
- Open the order window where you'll specify trade details such as quantity and price.
This streamlined process ensures traders can quickly move from analysis to execution without unnecessary delays.
How To Set Up Your Limit Order
After accessing the trading interface:
1. Choose 'Limit' as Your Order Type
Most platforms default to 'Market' orders; ensure you switch this setting explicitly to 'Limit.' This indicates you're setting specific conditions under which your trade will execute rather than accepting current market prices.
2. Enter Quantity
Specify how many units of an asset you'd like to buy or sell—this could be shares in stocks or units in cryptocurrencies.
3. Set Your Price
Input your desired execution price—the maximum you're willing (for buys) or minimum you're willing (for sells). Be precise here; small differences can impact whether your order gets filled quickly.
4. Select Time-in-Force Options
Decide how long your limit order remains active:
- GTC (Good Till Cancelled): Remains until manually canceled.
- GTD (Good Till Date): Expires after set date/time.
- Day: Cancels automatically if not filled during trading day.
Review all details carefully before submitting because once placed, these parameters govern how and when your trade executes.
Recent Platform Enhancements & Market Dynamics
TradingView has continually upgraded its features over recent years—adding advanced charting tools like drawing tools for technical analysis and improved risk management options such as stop-loss/take-profit settings integrated directly into their platform interface. These enhancements help traders make more informed decisions when placing limit orders based on real-time data insights rather than guesswork alone.
The cryptocurrency sector has experienced heightened volatility lately due to macroeconomic factors and regulatory shifts worldwide—a situation that amplifies reliance on strategic entry/exit points provided by limit orders for managing risk effectively amid rapid swings in prices across exchanges globally.
Additionally, regulatory changes have influenced how exchanges handle different types of orders including limits; some jurisdictions now impose stricter rules around execution times which may affect overall trading strategies involving these instructions.
Risks Associated With Limit Orders
While placing limits offers precision control over trades:
Market Liquidity: Large volumes of pending limit orders can temporarily distort supply-demand dynamics within certain assets’ markets leading potentially unpredictable short-term movements.
Order Execution Failures: If market conditions do not reach specified levels before expiration—or if they change suddenly—you might miss out entirely on intended trades resulting in opportunity costs.
Technological Glitches: Technical issues such as server outages during high-volatility periods could prevent timely placement/execution of critical trades—highlighting importance of choosing reliable platforms like TradingView with robust infrastructure.
Understanding these risks helps traders develop contingency plans—for example using alerts alongside limits—to mitigate potential downsides effectively.
Managing Expectations When Using Limit Orders
Successful use of limited instructions requires patience and strategic planning:
- Always monitor broader market trends alongside individual asset behavior before setting target prices.
- Use supplementary tools such as alerts so you're notified when assets approach desired levels—even if initial limits aren’t triggered immediately.
- Regularly review open positions; adjust limits based on evolving technical signals or fundamental news events impacting markets.
By combining disciplined planning with real-time data insights offered by platforms like TradingView—and staying aware of potential pitfalls—you enhance chances for successful trade executions aligned with personal investment goals.
Placing a limit order via TradingView is straightforward once familiarized with its interface features—from selecting appropriate assets and specifying precise parameters down to understanding recent platform updates and inherent risks involved in this strategy type. Mastery over this tool empowers traders seeking greater control over their entries/exits while navigating complex financial landscapes efficiently—and ultimately supports building resilient trading practices grounded in informed decision-making processes.
kai
2025-05-26 21:38
How do I place a limit order via TradingView?
How to Place a Limit Order on TradingView: A Step-by-Step Guide
Placing a limit order is a fundamental strategy for traders looking to execute trades at specific prices. Whether you are trading stocks, cryptocurrencies, or other assets on TradingView, understanding how to effectively set and manage limit orders can significantly improve your trading outcomes. This guide provides a clear overview of the process, recent platform updates, and potential risks involved.
What Is a Limit Order?
A limit order is an instruction to buy or sell an asset at a predetermined price or better. Unlike market orders that execute immediately at the current market price, limit orders only trigger when the asset reaches your specified price point. For example, if you want to buy Bitcoin at $30,000 but not higher, you would place a buy limit order with that exact price. The order remains pending until the market hits that level or your specified expiration time.
Limit orders are especially useful in volatile markets like cryptocurrencies where prices can fluctuate rapidly within short periods. They allow traders to control entry and exit points more precisely while avoiding unfavorable execution prices often associated with market orders.
Accessing TradingView for Limit Orders
TradingView offers both web-based and mobile platforms designed for user-friendly navigation and comprehensive chart analysis. To place a limit order:
- Log into your TradingView account via their website or mobile app.
- Navigate through the interface to select your desired financial instrument—be it stocks, crypto assets, forex pairs, etc.
- Use the search bar by entering the asset’s symbol (e.g., BTCUSD) or browse through available markets.
Once you've selected an asset:
- Click on "Trade" or "Order" buttons typically located near charts.
- Open the order window where you'll specify trade details such as quantity and price.
This streamlined process ensures traders can quickly move from analysis to execution without unnecessary delays.
How To Set Up Your Limit Order
After accessing the trading interface:
1. Choose 'Limit' as Your Order Type
Most platforms default to 'Market' orders; ensure you switch this setting explicitly to 'Limit.' This indicates you're setting specific conditions under which your trade will execute rather than accepting current market prices.
2. Enter Quantity
Specify how many units of an asset you'd like to buy or sell—this could be shares in stocks or units in cryptocurrencies.
3. Set Your Price
Input your desired execution price—the maximum you're willing (for buys) or minimum you're willing (for sells). Be precise here; small differences can impact whether your order gets filled quickly.
4. Select Time-in-Force Options
Decide how long your limit order remains active:
- GTC (Good Till Cancelled): Remains until manually canceled.
- GTD (Good Till Date): Expires after set date/time.
- Day: Cancels automatically if not filled during trading day.
Review all details carefully before submitting because once placed, these parameters govern how and when your trade executes.
Recent Platform Enhancements & Market Dynamics
TradingView has continually upgraded its features over recent years—adding advanced charting tools like drawing tools for technical analysis and improved risk management options such as stop-loss/take-profit settings integrated directly into their platform interface. These enhancements help traders make more informed decisions when placing limit orders based on real-time data insights rather than guesswork alone.
The cryptocurrency sector has experienced heightened volatility lately due to macroeconomic factors and regulatory shifts worldwide—a situation that amplifies reliance on strategic entry/exit points provided by limit orders for managing risk effectively amid rapid swings in prices across exchanges globally.
Additionally, regulatory changes have influenced how exchanges handle different types of orders including limits; some jurisdictions now impose stricter rules around execution times which may affect overall trading strategies involving these instructions.
Risks Associated With Limit Orders
While placing limits offers precision control over trades:
Market Liquidity: Large volumes of pending limit orders can temporarily distort supply-demand dynamics within certain assets’ markets leading potentially unpredictable short-term movements.
Order Execution Failures: If market conditions do not reach specified levels before expiration—or if they change suddenly—you might miss out entirely on intended trades resulting in opportunity costs.
Technological Glitches: Technical issues such as server outages during high-volatility periods could prevent timely placement/execution of critical trades—highlighting importance of choosing reliable platforms like TradingView with robust infrastructure.
Understanding these risks helps traders develop contingency plans—for example using alerts alongside limits—to mitigate potential downsides effectively.
Managing Expectations When Using Limit Orders
Successful use of limited instructions requires patience and strategic planning:
- Always monitor broader market trends alongside individual asset behavior before setting target prices.
- Use supplementary tools such as alerts so you're notified when assets approach desired levels—even if initial limits aren’t triggered immediately.
- Regularly review open positions; adjust limits based on evolving technical signals or fundamental news events impacting markets.
By combining disciplined planning with real-time data insights offered by platforms like TradingView—and staying aware of potential pitfalls—you enhance chances for successful trade executions aligned with personal investment goals.
Placing a limit order via TradingView is straightforward once familiarized with its interface features—from selecting appropriate assets and specifying precise parameters down to understanding recent platform updates and inherent risks involved in this strategy type. Mastery over this tool empowers traders seeking greater control over their entries/exits while navigating complex financial landscapes efficiently—and ultimately supports building resilient trading practices grounded in informed decision-making processes.
Disclaimer:Contains third-party content. Not financial advice.
See Terms and Conditions.
What Is a New Highs–New Lows Chart?
A New Highs–New Lows (NH-NL) chart is a vital technical analysis tool used by traders and investors to assess the overall health and sentiment of financial markets, including stocks and cryptocurrencies. It visually represents the number of assets reaching new highs or lows within a specific period, offering insights into whether the market is trending upward, downward, or remaining neutral. This chart helps market participants gauge momentum and potential turning points, making it an essential component of comprehensive trading strategies.
The NH-NL chart simplifies complex market data into an easy-to-understand visual format. By tracking how many securities are hitting record high prices versus those hitting record lows, traders can quickly interpret prevailing investor sentiment. For example, a surge in new highs typically indicates bullish momentum, while an increase in new lows suggests bearish conditions. When both are balanced or declining simultaneously, it may signal indecision or consolidation in the market.
How Does the NH-NL Chart Work?
The core principle behind the NH-NL chart involves counting assets that reach new price extremes over a chosen timeframe—be it daily, weekly, or monthly—and plotting these counts on a graph. The two primary components are:
- New Highs: The number of stocks or cryptocurrencies that have surpassed their previous peak prices during the observed period.
- New Lows: The count of assets falling below their prior lowest prices within that same timeframe.
These figures are then plotted as separate lines on the chart—one representing new highs and another for new lows—allowing traders to observe their relative movements over time.
When analyzing this data:
- A rising line for new highs coupled with declining lows generally signals strong bullish sentiment.
- Conversely, increasing new lows alongside decreasing highs often indicates bearish trends.
- Equal levels suggest market neutrality with no clear directional bias.
This straightforward visualization enables quick assessment without delving into detailed individual asset analysis.
Why Use a New Highs–New Lows Chart?
Investors utilize NH-NL charts because they provide real-time insight into overall market strength and potential trend reversals. Unlike traditional price charts focusing solely on individual securities’ movements, this indicator offers macro-level information about collective investor behavior across multiple assets.
For example:
During periods of high volatility—such as economic uncertainty—the NH-NL chart can reveal whether investors remain confident (more highs) or become risk-averse (more lows).
In trending markets: sustained increases in new highs suggest continued upward momentum; persistent rises in new lows warn of deteriorating conditions ahead.
Furthermore, integrating this tool with other technical indicators like Relative Strength Index (RSI), Moving Averages (MA), or Bollinger Bands enhances its predictive power by confirming signals derived from multiple sources.
Recent Trends and Market Applications
In recent years—including 2023 and early 2024—the NH-NL chart has gained prominence among traders navigating volatile environments like cryptocurrency markets. During 2023’s crypto crash—a period marked by sharp declines—the chart reflected heightened bearish sentiment through increased numbers of cryptocurrencies hitting fresh lows while fewer reached record highs. This pattern served as an early warning sign for investors to reduce exposure or tighten risk controls.
Conversely, early 2024 saw signs of recovery across major stock indices where the NH-NL indicator showed more assets achieving new highs than lows—a positive signal pointing toward bullish momentum amid broader economic optimism. Such shifts underscore how dynamic this tool can be when monitoring evolving market conditions.
In addition to traditional equities and digital currencies, institutional investors increasingly incorporate NH-NL charts into their analytical frameworks alongside volume analysis and macroeconomic data to refine entry/exit points and manage portfolio risks effectively.
Limitations And Risks Of Relying On This Indicator
While highly informative when used correctly, relying solely on New Highs–New Lows charts carries certain limitations:
- Lagging Nature: Like most technical indicators based on historical data; they reflect past activity rather than predicting future moves directly.
- Market Noise: Short-term fluctuations might produce misleading signals if not interpreted within context; sudden spikes could be temporary rather than indicative of long-term trends.
- Asset Class Variability: Different markets behave uniquely; what works well for equities might not translate seamlessly to cryptocurrencies due to differing volatility patterns.
- Complementary Tools Needed: To improve accuracy — combining NH-NL charts with volume metrics or trend-following indicators enhances decision-making quality.
Practical Tips For Using The Chart Effectively
To maximize its utility:
Use multiple timeframes: Short-term views help identify immediate shifts; longer periods provide broader trend confirmation.
Watch for divergences: When one line diverges significantly from another—for instance ,new highs rise sharply while low counts remain stable—it could signal weakening momentum before reversal occurs.
Combine with other indicators: Confirm signals using RSI levels indicating overbought/oversold conditions or moving averages showing trend directionality.
By applying these best practices consistently within your trading plan—whether you’re managing stocks or digital currencies—you improve your ability to anticipate changes before they fully materialize.
How To Incorporate Into Your Trading Strategy
Integrating an NH–NL chart into your investment approach involves understanding its role as part of a broader analytical toolkit:
- Identify prevailing trends by observing whether more assets hit records high versus low points regularly.
- Use divergence signals as early warnings for potential reversals—especially when combined with volume spikes indicating increased trader activity.
- Adjust position sizes accordingly during periods where imbalance between high/low counts suggests heightened volatility risks.
- Monitor ongoing shifts over different timeframes to confirm emerging patterns before executing trades based on these insights.
Final Thoughts
The New Highs–New Lows chart remains one of the most accessible yet powerful tools available for assessing overall market health at a glance . Its ability to distill complex collective asset movements into simple visual cues makes it invaluable across various asset classes—from traditional stocks to volatile cryptocurrencies . As part of diligent technical analysis practice—and complemented by other tools—it helps traders make informed decisions rooted in real-time sentiment rather than speculation alone.
Note: Always remember that no single indicator guarantees success; combining multiple analyses along with sound risk management principles is essential for sustainable trading performance.
JCUSER-WVMdslBw
2025-05-19 05:37
What is New Highs–New Lows Chart?
What Is a New Highs–New Lows Chart?
A New Highs–New Lows (NH-NL) chart is a vital technical analysis tool used by traders and investors to assess the overall health and sentiment of financial markets, including stocks and cryptocurrencies. It visually represents the number of assets reaching new highs or lows within a specific period, offering insights into whether the market is trending upward, downward, or remaining neutral. This chart helps market participants gauge momentum and potential turning points, making it an essential component of comprehensive trading strategies.
The NH-NL chart simplifies complex market data into an easy-to-understand visual format. By tracking how many securities are hitting record high prices versus those hitting record lows, traders can quickly interpret prevailing investor sentiment. For example, a surge in new highs typically indicates bullish momentum, while an increase in new lows suggests bearish conditions. When both are balanced or declining simultaneously, it may signal indecision or consolidation in the market.
How Does the NH-NL Chart Work?
The core principle behind the NH-NL chart involves counting assets that reach new price extremes over a chosen timeframe—be it daily, weekly, or monthly—and plotting these counts on a graph. The two primary components are:
- New Highs: The number of stocks or cryptocurrencies that have surpassed their previous peak prices during the observed period.
- New Lows: The count of assets falling below their prior lowest prices within that same timeframe.
These figures are then plotted as separate lines on the chart—one representing new highs and another for new lows—allowing traders to observe their relative movements over time.
When analyzing this data:
- A rising line for new highs coupled with declining lows generally signals strong bullish sentiment.
- Conversely, increasing new lows alongside decreasing highs often indicates bearish trends.
- Equal levels suggest market neutrality with no clear directional bias.
This straightforward visualization enables quick assessment without delving into detailed individual asset analysis.
Why Use a New Highs–New Lows Chart?
Investors utilize NH-NL charts because they provide real-time insight into overall market strength and potential trend reversals. Unlike traditional price charts focusing solely on individual securities’ movements, this indicator offers macro-level information about collective investor behavior across multiple assets.
For example:
During periods of high volatility—such as economic uncertainty—the NH-NL chart can reveal whether investors remain confident (more highs) or become risk-averse (more lows).
In trending markets: sustained increases in new highs suggest continued upward momentum; persistent rises in new lows warn of deteriorating conditions ahead.
Furthermore, integrating this tool with other technical indicators like Relative Strength Index (RSI), Moving Averages (MA), or Bollinger Bands enhances its predictive power by confirming signals derived from multiple sources.
Recent Trends and Market Applications
In recent years—including 2023 and early 2024—the NH-NL chart has gained prominence among traders navigating volatile environments like cryptocurrency markets. During 2023’s crypto crash—a period marked by sharp declines—the chart reflected heightened bearish sentiment through increased numbers of cryptocurrencies hitting fresh lows while fewer reached record highs. This pattern served as an early warning sign for investors to reduce exposure or tighten risk controls.
Conversely, early 2024 saw signs of recovery across major stock indices where the NH-NL indicator showed more assets achieving new highs than lows—a positive signal pointing toward bullish momentum amid broader economic optimism. Such shifts underscore how dynamic this tool can be when monitoring evolving market conditions.
In addition to traditional equities and digital currencies, institutional investors increasingly incorporate NH-NL charts into their analytical frameworks alongside volume analysis and macroeconomic data to refine entry/exit points and manage portfolio risks effectively.
Limitations And Risks Of Relying On This Indicator
While highly informative when used correctly, relying solely on New Highs–New Lows charts carries certain limitations:
- Lagging Nature: Like most technical indicators based on historical data; they reflect past activity rather than predicting future moves directly.
- Market Noise: Short-term fluctuations might produce misleading signals if not interpreted within context; sudden spikes could be temporary rather than indicative of long-term trends.
- Asset Class Variability: Different markets behave uniquely; what works well for equities might not translate seamlessly to cryptocurrencies due to differing volatility patterns.
- Complementary Tools Needed: To improve accuracy — combining NH-NL charts with volume metrics or trend-following indicators enhances decision-making quality.
Practical Tips For Using The Chart Effectively
To maximize its utility:
Use multiple timeframes: Short-term views help identify immediate shifts; longer periods provide broader trend confirmation.
Watch for divergences: When one line diverges significantly from another—for instance ,new highs rise sharply while low counts remain stable—it could signal weakening momentum before reversal occurs.
Combine with other indicators: Confirm signals using RSI levels indicating overbought/oversold conditions or moving averages showing trend directionality.
By applying these best practices consistently within your trading plan—whether you’re managing stocks or digital currencies—you improve your ability to anticipate changes before they fully materialize.
How To Incorporate Into Your Trading Strategy
Integrating an NH–NL chart into your investment approach involves understanding its role as part of a broader analytical toolkit:
- Identify prevailing trends by observing whether more assets hit records high versus low points regularly.
- Use divergence signals as early warnings for potential reversals—especially when combined with volume spikes indicating increased trader activity.
- Adjust position sizes accordingly during periods where imbalance between high/low counts suggests heightened volatility risks.
- Monitor ongoing shifts over different timeframes to confirm emerging patterns before executing trades based on these insights.
Final Thoughts
The New Highs–New Lows chart remains one of the most accessible yet powerful tools available for assessing overall market health at a glance . Its ability to distill complex collective asset movements into simple visual cues makes it invaluable across various asset classes—from traditional stocks to volatile cryptocurrencies . As part of diligent technical analysis practice—and complemented by other tools—it helps traders make informed decisions rooted in real-time sentiment rather than speculation alone.
Note: Always remember that no single indicator guarantees success; combining multiple analyses along with sound risk management principles is essential for sustainable trading performance.
Disclaimer:Contains third-party content. Not financial advice.
See Terms and Conditions.
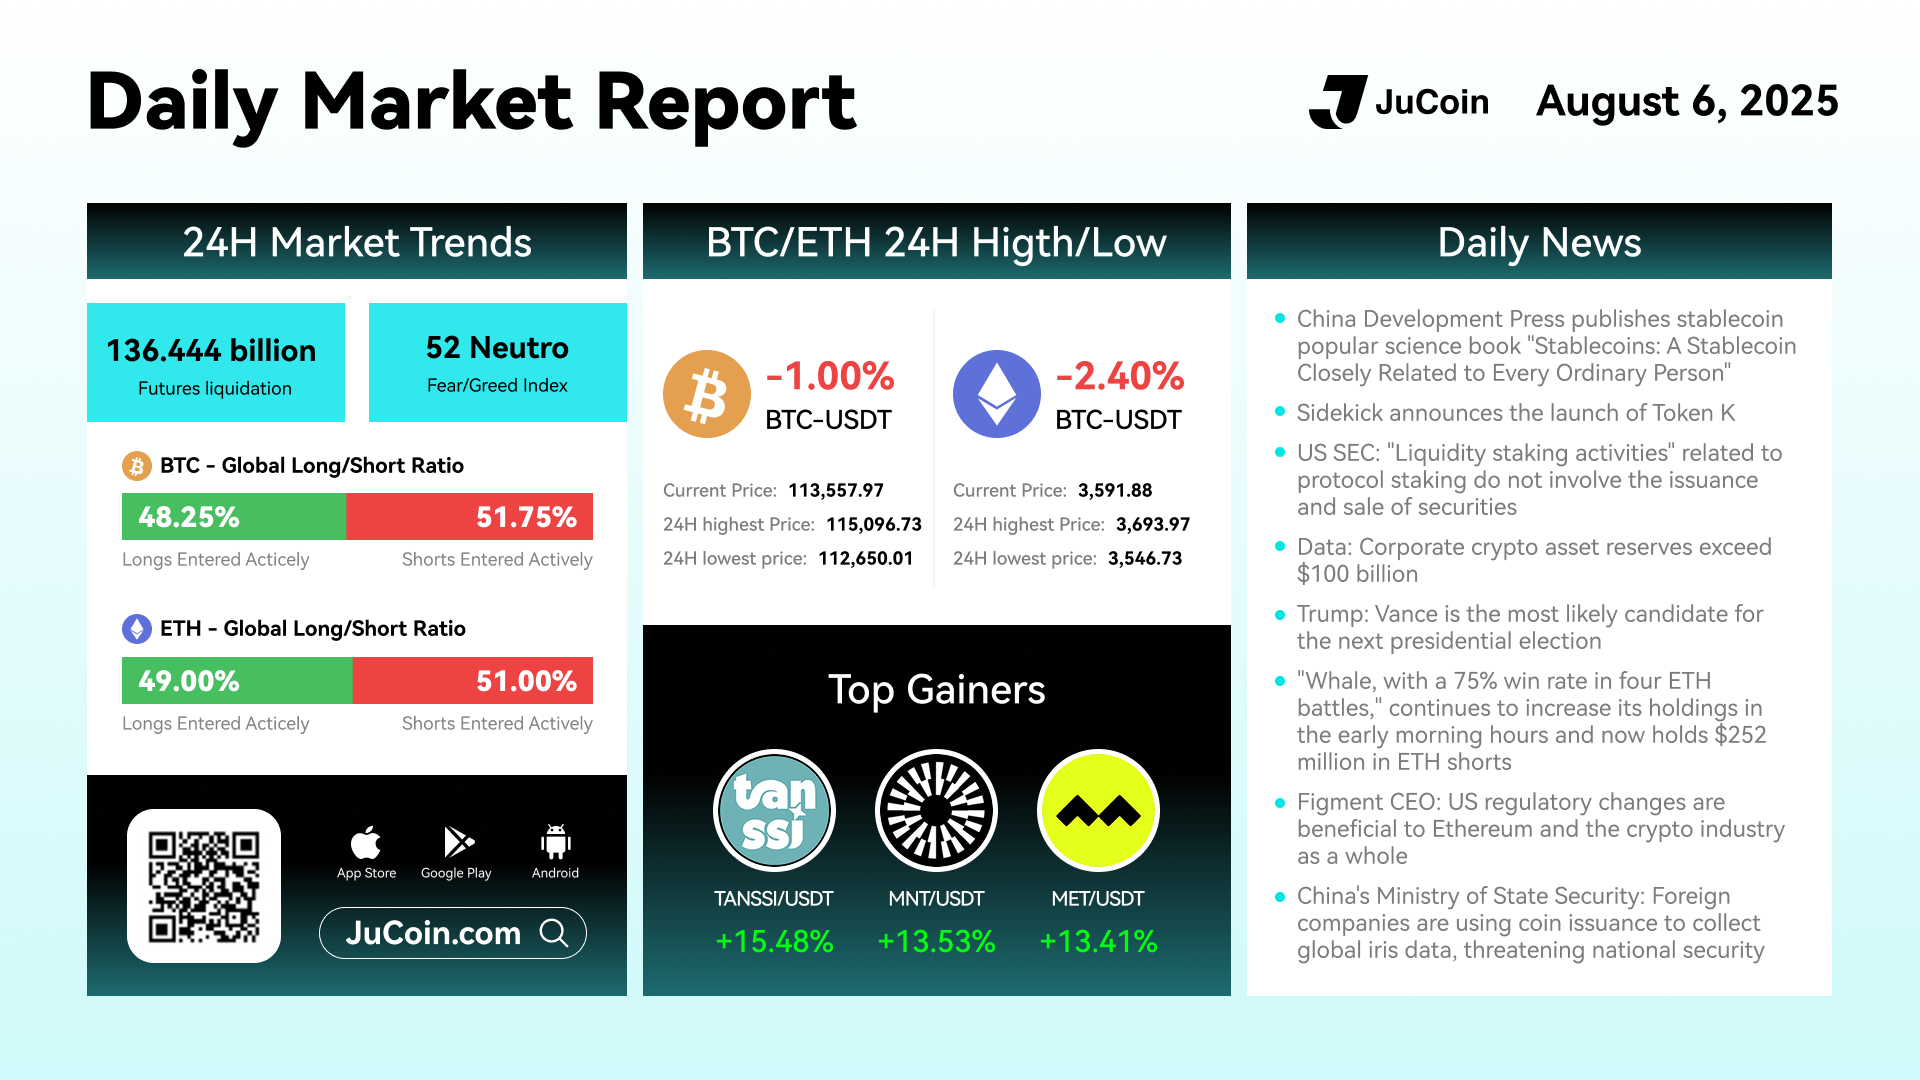
📅 August 6 2025
🎉 Stay updated with the latest crypto market trends!
👉 Trade on:https://bit.ly/3DFYq30
👉 X:https://twitter.com/Jucoinex
👉 APP download: https://www.jucoin.com/en/community-downloads

JuCoin Community
2025-08-06 04:51
#JuCoin Daily Market Report
Disclaimer:Contains third-party content. Not financial advice.
See Terms and Conditions.
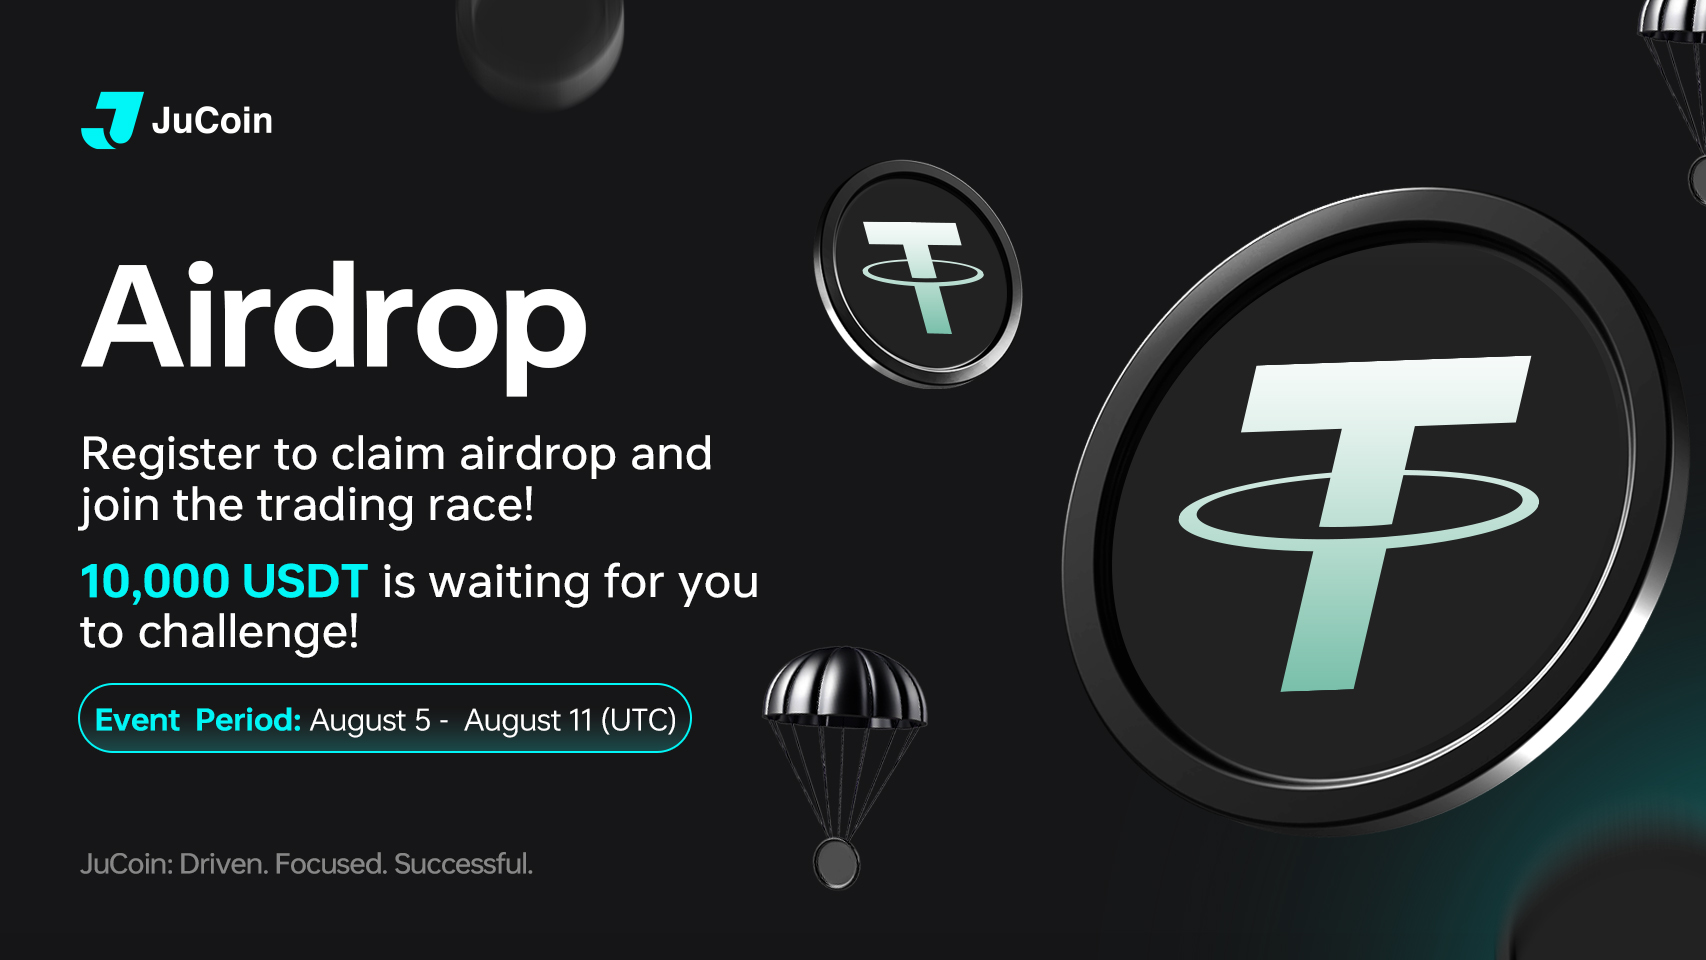
⏰ Time: 2025/8/5 21:00:00 - 2025/8/11 23:59:59(UTC)
✅ Activity 1: Register and complete the trading tasks below to receive one share of the airdrop.
✅ Activity 2: Trade ahead and get 5 USDT airdrop
✅ Activity 3: Sunshine Award, register and get 10 USDT equivalent tokens
🔸 More details:https://bit.ly/453FTc5
JuCoin Community
2025-08-05 15:25
💙Airdrop Tuesday: Register to receive airdrops and trade for 10,000 USDT 🎉
Disclaimer:Contains third-party content. Not financial advice.
See Terms and Conditions.
Understanding Credit Spreads and Their Risks
Credit spreads are a fundamental concept in bond markets, representing the difference in yield between two bonds with similar credit ratings but different maturities. They serve as a vital indicator of market sentiment and perceived risk, helping investors gauge the likelihood of default and overall financial stability. By analyzing credit spreads, investors can make more informed decisions about which bonds to include in their portfolios.
What Are Credit Spreads?
At its core, a credit spread measures the additional yield an investor earns for taking on higher risk compared to a benchmark government bond or other low-risk securities. For example, if a corporate bond offers 5% yield while comparable U.S. Treasury bonds offer 2%, the 3% difference is the credit spread. This spread reflects how much extra compensation investors require for bearing increased default risk associated with corporate debt.
In practice, narrower spreads suggest that investors perceive lower risk—perhaps due to stable economic conditions—while wider spreads indicate heightened concern over potential defaults or economic downturns. These fluctuations provide insights into market confidence and can signal shifts in economic outlooks.
Factors Influencing Credit Spreads
Several key factors impact how credit spreads behave:
Economic Conditions: During periods of economic growth and stability, credit spreads tend to narrow as default risks decrease. Conversely, during recessions or financial crises, spreads widen as concerns over borrower solvency increase.
Interest Rates: Rising interest rates often lead to wider credit spreads because borrowing becomes more expensive for companies, increasing their default likelihood. Lower interest rates generally have the opposite effect.
Market Sentiment: Investor confidence plays a crucial role; positive sentiment leads to narrowing spreads as demand for risky assets increases. Negative news or geopolitical uncertainties tend to widen these gaps.
Understanding these influences helps investors anticipate potential changes in market dynamics that could affect their fixed-income investments.
Recent Trends in Credit Spreads (2025 Context)
As of mid-2025, despite volatility across government bond markets—especially around U.S. Treasuries—credit spreads on high-yield US corporate bonds have remained relatively stable[1]. This stability suggests that while broader markets experience fluctuations driven by macroeconomic factors like trade policies and fiscal uncertainties[2], certain segments maintain resilience temporarily.
However, persistent uncertainty surrounding U.S. fiscal policy and trade relations continues to pose risks for specific bond funds[2]. Tightening credit conditions could lead to widening spreads if investor confidence diminishes further or if economic indicators worsen unexpectedly.
Risks Associated with Widening Credit Spreads
Widening credit spreads are often viewed as warning signs of deteriorating market conditions or increasing default risks within specific sectors or issuers. For investors holding bonds with wide margins:
Higher Default Risk: As spread widening indicates perceived higher chances of issuer failure, there’s an increased probability that some borrowers may fail to meet payment obligations.
Potential Capital Losses: Bonds trading at wider yields may decline in value if market perceptions shift further negative before maturity.
Liquidity Concerns: During times of stress when spreads widen rapidly, liquidity can dry up — making it difficult for investors to sell holdings without incurring losses.
For fund managers managing diversified portfolios containing high-yield assets like CLO ETFs (Collateralized Loan Obligations), monitoring these movements is critical since tightening or widening trends directly impact future performance prospects[3].
Risks Linked With Narrowing Credit Spreads
While narrower credits might seem safer due to reduced perceived risk levels:
Complacency Risk: Investors might underestimate underlying vulnerabilities within seemingly stable sectors leading up to sudden shocks.
Market Overconfidence: Excessively tight spreads could reflect overly optimistic sentiment disconnected from actual fundamentals—a setup prone for abrupt corrections during unforeseen events.
This environment underscores why vigilance remains essential even when markets appear calm; complacency can be dangerous when assessing long-term investment strategies.
Managing Risks Through Diversification & Due Diligence
Given these complexities:
Diversify across sectors and asset classes: A well-balanced portfolio mitigates exposure from any single sector experiencing widening or tightening trends.
Conduct thorough research: Regularly review issuer fundamentals alongside macroeconomic indicators influencing spread movements.
Use hedging strategies: Options and other derivatives can help protect against adverse shifts caused by unexpected changes in credit premiums.
By implementing disciplined risk management practices aligned with current market signals—such as monitoring recent developments like volatile rate environments—investors enhance resilience against potential fallout from changing credit spread dynamics[4].
How Market Volatility Affects Investment Strategies
Volatility introduces additional layers of complexity into fixed-income investing because rapid swings in interest rates or geopolitical tensions directly influence credit spread behavior.[1][2] During turbulent periods—as seen recently—the challenge lies not only in predicting direction but also managing timing effectively so portfolios remain resilient amid unpredictable shifts.[4]
Investors should stay informed through credible sources about ongoing macroeconomic developments impacting both government securities and corporate debt instruments alike.[3] Maintaining flexibility allows adjustments aligned with evolving conditions rather than static assumptions based solely on historical data patterns.
Final Thoughts: Navigating Risks Involving Credit Spreads
Understanding what drives changes in credit premiums equips investors with better tools for navigating complex financial landscapes today’s uncertain environment presents unique challenges—and opportunities—for those who approach fixed income investing thoughtfully.[1][2] Recognizing signs such as widening versus narrowing trends enables proactive decision-making aimed at safeguarding capital while capturing attractive yields where appropriate.[4]
In essence:
- Keep abreast of macroeconomic signals
- Diversify holdings prudently
- Monitor issuer-specific fundamentals regularly
- Be prepared for sudden shifts driven by global events
By doing so—and maintaining disciplined oversight—you position yourself better against inherent risks tied closely linked with fluctuations in credit spreds across various asset classes.
References
1. Market Update June 2025 – High-Yield US Corporate Bonds Stability Despite Volatility
2. Policy Uncertainty & Bond Fund Risks – June 2025 Report
3. CLO ETF Performance & Monitoring – June 2025 Analysis
4. Fixed Income Market Volatility – Strategic Implications
kai
2025-06-09 22:04
What risks are involved with credit spreads?
Understanding Credit Spreads and Their Risks
Credit spreads are a fundamental concept in bond markets, representing the difference in yield between two bonds with similar credit ratings but different maturities. They serve as a vital indicator of market sentiment and perceived risk, helping investors gauge the likelihood of default and overall financial stability. By analyzing credit spreads, investors can make more informed decisions about which bonds to include in their portfolios.
What Are Credit Spreads?
At its core, a credit spread measures the additional yield an investor earns for taking on higher risk compared to a benchmark government bond or other low-risk securities. For example, if a corporate bond offers 5% yield while comparable U.S. Treasury bonds offer 2%, the 3% difference is the credit spread. This spread reflects how much extra compensation investors require for bearing increased default risk associated with corporate debt.
In practice, narrower spreads suggest that investors perceive lower risk—perhaps due to stable economic conditions—while wider spreads indicate heightened concern over potential defaults or economic downturns. These fluctuations provide insights into market confidence and can signal shifts in economic outlooks.
Factors Influencing Credit Spreads
Several key factors impact how credit spreads behave:
Economic Conditions: During periods of economic growth and stability, credit spreads tend to narrow as default risks decrease. Conversely, during recessions or financial crises, spreads widen as concerns over borrower solvency increase.
Interest Rates: Rising interest rates often lead to wider credit spreads because borrowing becomes more expensive for companies, increasing their default likelihood. Lower interest rates generally have the opposite effect.
Market Sentiment: Investor confidence plays a crucial role; positive sentiment leads to narrowing spreads as demand for risky assets increases. Negative news or geopolitical uncertainties tend to widen these gaps.
Understanding these influences helps investors anticipate potential changes in market dynamics that could affect their fixed-income investments.
Recent Trends in Credit Spreads (2025 Context)
As of mid-2025, despite volatility across government bond markets—especially around U.S. Treasuries—credit spreads on high-yield US corporate bonds have remained relatively stable[1]. This stability suggests that while broader markets experience fluctuations driven by macroeconomic factors like trade policies and fiscal uncertainties[2], certain segments maintain resilience temporarily.
However, persistent uncertainty surrounding U.S. fiscal policy and trade relations continues to pose risks for specific bond funds[2]. Tightening credit conditions could lead to widening spreads if investor confidence diminishes further or if economic indicators worsen unexpectedly.
Risks Associated with Widening Credit Spreads
Widening credit spreads are often viewed as warning signs of deteriorating market conditions or increasing default risks within specific sectors or issuers. For investors holding bonds with wide margins:
Higher Default Risk: As spread widening indicates perceived higher chances of issuer failure, there’s an increased probability that some borrowers may fail to meet payment obligations.
Potential Capital Losses: Bonds trading at wider yields may decline in value if market perceptions shift further negative before maturity.
Liquidity Concerns: During times of stress when spreads widen rapidly, liquidity can dry up — making it difficult for investors to sell holdings without incurring losses.
For fund managers managing diversified portfolios containing high-yield assets like CLO ETFs (Collateralized Loan Obligations), monitoring these movements is critical since tightening or widening trends directly impact future performance prospects[3].
Risks Linked With Narrowing Credit Spreads
While narrower credits might seem safer due to reduced perceived risk levels:
Complacency Risk: Investors might underestimate underlying vulnerabilities within seemingly stable sectors leading up to sudden shocks.
Market Overconfidence: Excessively tight spreads could reflect overly optimistic sentiment disconnected from actual fundamentals—a setup prone for abrupt corrections during unforeseen events.
This environment underscores why vigilance remains essential even when markets appear calm; complacency can be dangerous when assessing long-term investment strategies.
Managing Risks Through Diversification & Due Diligence
Given these complexities:
Diversify across sectors and asset classes: A well-balanced portfolio mitigates exposure from any single sector experiencing widening or tightening trends.
Conduct thorough research: Regularly review issuer fundamentals alongside macroeconomic indicators influencing spread movements.
Use hedging strategies: Options and other derivatives can help protect against adverse shifts caused by unexpected changes in credit premiums.
By implementing disciplined risk management practices aligned with current market signals—such as monitoring recent developments like volatile rate environments—investors enhance resilience against potential fallout from changing credit spread dynamics[4].
How Market Volatility Affects Investment Strategies
Volatility introduces additional layers of complexity into fixed-income investing because rapid swings in interest rates or geopolitical tensions directly influence credit spread behavior.[1][2] During turbulent periods—as seen recently—the challenge lies not only in predicting direction but also managing timing effectively so portfolios remain resilient amid unpredictable shifts.[4]
Investors should stay informed through credible sources about ongoing macroeconomic developments impacting both government securities and corporate debt instruments alike.[3] Maintaining flexibility allows adjustments aligned with evolving conditions rather than static assumptions based solely on historical data patterns.
Final Thoughts: Navigating Risks Involving Credit Spreads
Understanding what drives changes in credit premiums equips investors with better tools for navigating complex financial landscapes today’s uncertain environment presents unique challenges—and opportunities—for those who approach fixed income investing thoughtfully.[1][2] Recognizing signs such as widening versus narrowing trends enables proactive decision-making aimed at safeguarding capital while capturing attractive yields where appropriate.[4]
In essence:
- Keep abreast of macroeconomic signals
- Diversify holdings prudently
- Monitor issuer-specific fundamentals regularly
- Be prepared for sudden shifts driven by global events
By doing so—and maintaining disciplined oversight—you position yourself better against inherent risks tied closely linked with fluctuations in credit spreds across various asset classes.
References
1. Market Update June 2025 – High-Yield US Corporate Bonds Stability Despite Volatility
2. Policy Uncertainty & Bond Fund Risks – June 2025 Report
3. CLO ETF Performance & Monitoring – June 2025 Analysis
4. Fixed Income Market Volatility – Strategic Implications
Disclaimer:Contains third-party content. Not financial advice.
See Terms and Conditions.
How the Crypto Fear & Greed Index Helps Traders Make Better Decisions
Understanding market sentiment is crucial for successful trading, especially in the highly volatile world of cryptocurrencies. The Crypto Fear & Greed Index offers traders a valuable tool to gauge investor emotions and anticipate potential market movements. By analyzing this index, traders can enhance their decision-making process, manage risks more effectively, and identify optimal entry and exit points.
What Is the Crypto Fear & Greed Index?
The Crypto Fear & Greed Index is an algorithmic indicator designed to measure the overall sentiment of cryptocurrency investors. Created by Alternative.me in 2018, it synthesizes various data points—such as price volatility, trading volume, social media activity (like Twitter sentiment), and market capitalization—to produce a single score reflecting current market emotions. This score ranges from 0 to 100: lower values indicate fear or panic selling among investors; higher values suggest greed or overconfidence.
This index mirrors similar tools used in traditional financial markets but tailored specifically for cryptocurrencies' unique dynamics. Its primary purpose is to provide traders with a quick snapshot of whether the market is overly fearful or excessively greedy—conditions that often precede significant price reversals.
How Does the Index Work?
The index operates on a scale from 0 to 100:
- 0-24: Extreme Fear – Investors are panicking; prices may be undervalued.
- 25-49: Fear – Caution prevails; some selling pressure exists.
- 50: Neutral – Market shows balanced sentiment.
- 51-74: Greed – Optimism increases; prices might be overbought.
- 75-100: Extreme Greed – Overconfidence dominates; risk of correction rises.
Traders interpret these signals differently depending on their strategies. For example, extreme fear levels might signal buying opportunities due to potential undervaluation, while extreme greed could warn against entering new long positions or suggest taking profits.
Why Is Sentiment Analysis Important in Cryptocurrency Trading?
Cryptocurrency markets are known for their high volatility driven not only by technical factors but also by emotional reactions among investors. FOMO (Fear Of Missing Out), panic selling during downturns, and exuberance during rallies can all lead to irrational decision-making that deviates from fundamental analysis.
Sentiment analysis tools like the Crypto Fear & Greed Index help traders cut through emotional noise by providing objective data about prevailing investor moods. Recognizing when markets are overly fearful can present contrarian buying opportunities—buy low scenarios—while identifying excessive greed may prompt caution or profit-taking before a correction occurs.
Practical Ways Traders Use the Index
Traders incorporate the Crypto Fear & Greed Index into their strategies through various approaches:
- Contrarian Investing: Buying when fear levels are high (index below 25) with expectations of rebound.
- Profit Taking: Selling or reducing exposure when greed levels reach extremes (above 75).
- Market Timing: Combining index signals with technical analysis for more precise entries/exits.
- Risk Management: Adjusting position sizes based on current sentiment—smaller trades during uncertain times and larger ones when confidence is high.
Additionally, many traders use historical patterns observed via this index as part of broader trend analysis models aimed at predicting future movements based on past behavior under similar sentiment conditions.
Limitations and Risks
While valuable, reliance solely on the Crypto Fear & Greed Index has its pitfalls:
It provides a snapshot rather than comprehensive insight into fundamentals such as project development progress or macroeconomic factors influencing crypto prices.
Market sentiments can remain irrational longer than expected—a phenomenon known as "market timing risk."
Overreacting to short-term swings in sentiment may lead traders astray if they ignore underlying asset fundamentals or broader economic indicators.
Therefore, it's essential for traders to combine this tool with other forms of analysis—including technical charts, news events tracking, macroeconomic data—and maintain disciplined risk management practices.
Recent Trends Enhancing Its Effectiveness
In recent years, technological advancements have improved how accurately this index reflects real-time market psychology:
The integration of machine learning algorithms allows for better pattern recognition across diverse data sources such as social media trends and trading volumes.
Updates introduced by Alternative.me have expanded data inputs beyond basic metrics—for example incorporating network activity metrics—to refine sentiment assessment further.
These improvements make it easier for traders to interpret current conditions more reliably than ever before while adapting quickly during rapid shifts like those seen during major events such as exchange collapses or regulatory crackdowns.
Furthermore, increased community engagement around behavioral finance concepts has led many retail investors and institutional players alike to pay closer attention not just individually but collectively—as reflected through indices like these—in shaping overall market dynamics.
By understanding how investor emotions influence cryptocurrency prices—and leveraging tools like the Crypto Fear & Greed Index—traders gain an edge in navigating unpredictable markets. While no single indicator guarantees success alone—the key lies in combining multiple analytical methods—they serve as vital components within a comprehensive trading strategy rooted in informed decision-making rather than impulsive reactions driven purely by emotion.
Keywords:
Crypto Market Sentiment | Cryptocurrency Trading Strategies | Investor Emotions | Technical Analysis | Risk Management | Market Psychology
kai
2025-06-09 19:54
How can the Crypto Fear & Greed Index help traders make better decisions?
How the Crypto Fear & Greed Index Helps Traders Make Better Decisions
Understanding market sentiment is crucial for successful trading, especially in the highly volatile world of cryptocurrencies. The Crypto Fear & Greed Index offers traders a valuable tool to gauge investor emotions and anticipate potential market movements. By analyzing this index, traders can enhance their decision-making process, manage risks more effectively, and identify optimal entry and exit points.
What Is the Crypto Fear & Greed Index?
The Crypto Fear & Greed Index is an algorithmic indicator designed to measure the overall sentiment of cryptocurrency investors. Created by Alternative.me in 2018, it synthesizes various data points—such as price volatility, trading volume, social media activity (like Twitter sentiment), and market capitalization—to produce a single score reflecting current market emotions. This score ranges from 0 to 100: lower values indicate fear or panic selling among investors; higher values suggest greed or overconfidence.
This index mirrors similar tools used in traditional financial markets but tailored specifically for cryptocurrencies' unique dynamics. Its primary purpose is to provide traders with a quick snapshot of whether the market is overly fearful or excessively greedy—conditions that often precede significant price reversals.
How Does the Index Work?
The index operates on a scale from 0 to 100:
- 0-24: Extreme Fear – Investors are panicking; prices may be undervalued.
- 25-49: Fear – Caution prevails; some selling pressure exists.
- 50: Neutral – Market shows balanced sentiment.
- 51-74: Greed – Optimism increases; prices might be overbought.
- 75-100: Extreme Greed – Overconfidence dominates; risk of correction rises.
Traders interpret these signals differently depending on their strategies. For example, extreme fear levels might signal buying opportunities due to potential undervaluation, while extreme greed could warn against entering new long positions or suggest taking profits.
Why Is Sentiment Analysis Important in Cryptocurrency Trading?
Cryptocurrency markets are known for their high volatility driven not only by technical factors but also by emotional reactions among investors. FOMO (Fear Of Missing Out), panic selling during downturns, and exuberance during rallies can all lead to irrational decision-making that deviates from fundamental analysis.
Sentiment analysis tools like the Crypto Fear & Greed Index help traders cut through emotional noise by providing objective data about prevailing investor moods. Recognizing when markets are overly fearful can present contrarian buying opportunities—buy low scenarios—while identifying excessive greed may prompt caution or profit-taking before a correction occurs.
Practical Ways Traders Use the Index
Traders incorporate the Crypto Fear & Greed Index into their strategies through various approaches:
- Contrarian Investing: Buying when fear levels are high (index below 25) with expectations of rebound.
- Profit Taking: Selling or reducing exposure when greed levels reach extremes (above 75).
- Market Timing: Combining index signals with technical analysis for more precise entries/exits.
- Risk Management: Adjusting position sizes based on current sentiment—smaller trades during uncertain times and larger ones when confidence is high.
Additionally, many traders use historical patterns observed via this index as part of broader trend analysis models aimed at predicting future movements based on past behavior under similar sentiment conditions.
Limitations and Risks
While valuable, reliance solely on the Crypto Fear & Greed Index has its pitfalls:
It provides a snapshot rather than comprehensive insight into fundamentals such as project development progress or macroeconomic factors influencing crypto prices.
Market sentiments can remain irrational longer than expected—a phenomenon known as "market timing risk."
Overreacting to short-term swings in sentiment may lead traders astray if they ignore underlying asset fundamentals or broader economic indicators.
Therefore, it's essential for traders to combine this tool with other forms of analysis—including technical charts, news events tracking, macroeconomic data—and maintain disciplined risk management practices.
Recent Trends Enhancing Its Effectiveness
In recent years, technological advancements have improved how accurately this index reflects real-time market psychology:
The integration of machine learning algorithms allows for better pattern recognition across diverse data sources such as social media trends and trading volumes.
Updates introduced by Alternative.me have expanded data inputs beyond basic metrics—for example incorporating network activity metrics—to refine sentiment assessment further.
These improvements make it easier for traders to interpret current conditions more reliably than ever before while adapting quickly during rapid shifts like those seen during major events such as exchange collapses or regulatory crackdowns.
Furthermore, increased community engagement around behavioral finance concepts has led many retail investors and institutional players alike to pay closer attention not just individually but collectively—as reflected through indices like these—in shaping overall market dynamics.
By understanding how investor emotions influence cryptocurrency prices—and leveraging tools like the Crypto Fear & Greed Index—traders gain an edge in navigating unpredictable markets. While no single indicator guarantees success alone—the key lies in combining multiple analytical methods—they serve as vital components within a comprehensive trading strategy rooted in informed decision-making rather than impulsive reactions driven purely by emotion.
Keywords:
Crypto Market Sentiment | Cryptocurrency Trading Strategies | Investor Emotions | Technical Analysis | Risk Management | Market Psychology
Disclaimer:Contains third-party content. Not financial advice.
See Terms and Conditions.